Facebook
 X
X
 Pinterest
 Copy Link
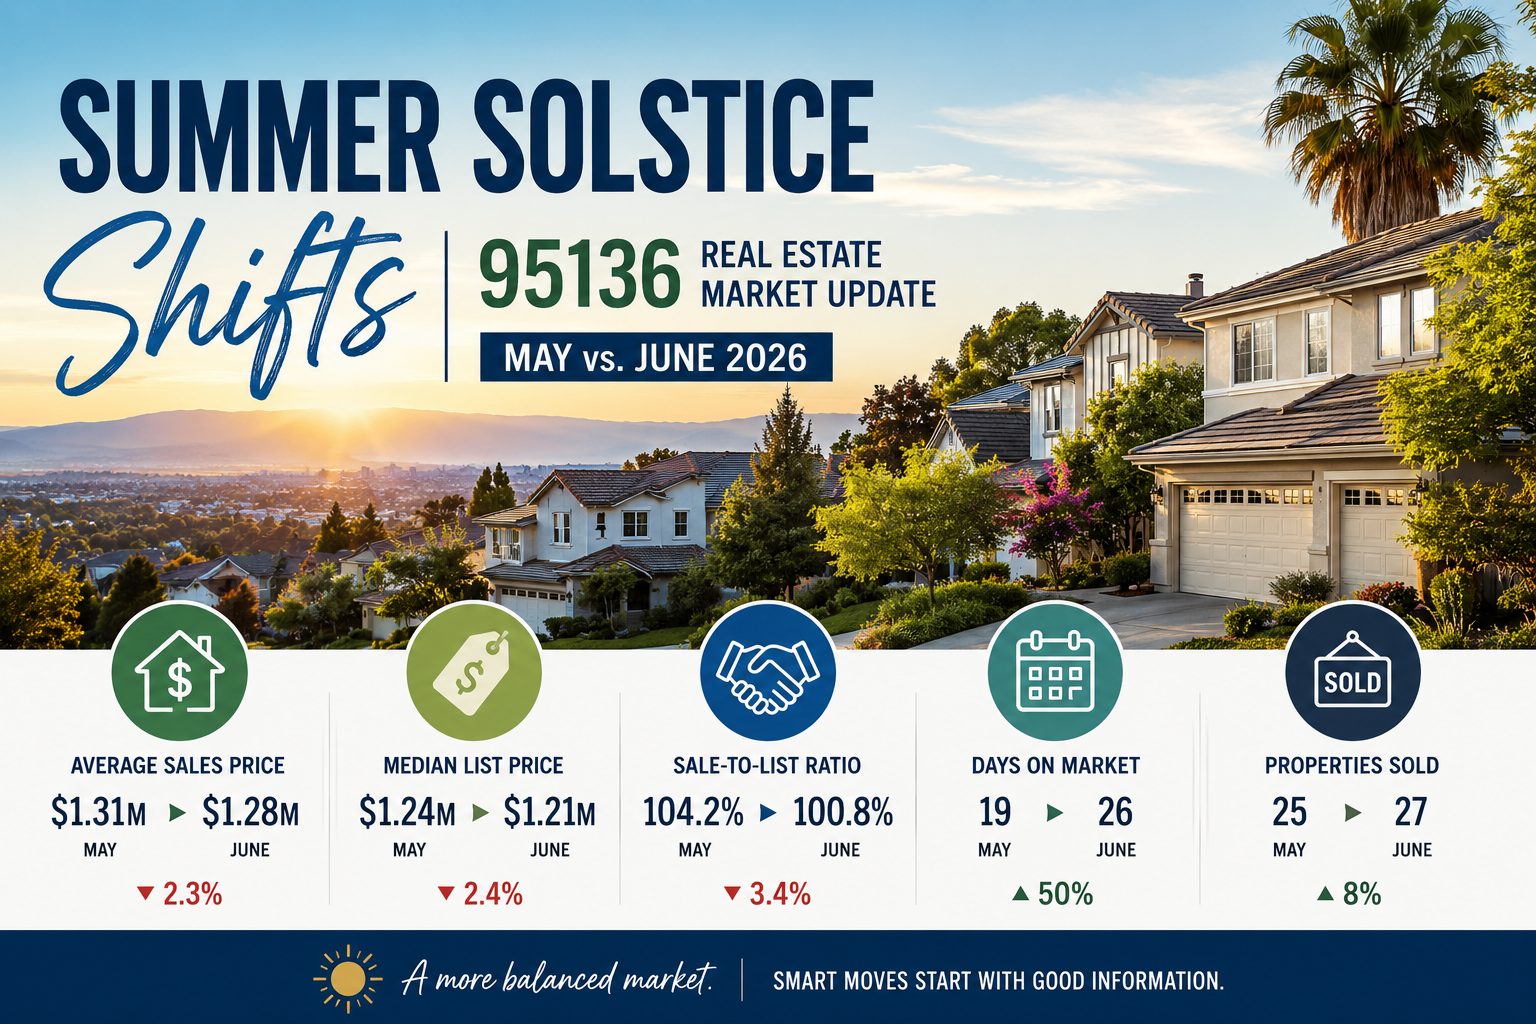
As spring transitioned into summer, the 95136 San Jose real estate market showed some meaningful changes for buyers.
Home prices eased slightly. Homes took longer to sell. And perhaps most importantly for buyers who spent the spring competing against aggressive offers, homes sold much closer to their asking prices in June.
But that doesn’t mean demand disappeared.
More homes actually closed in June than in May, suggesting that buyers were still active—they simply weren’t facing quite the same level of price pressure.
If you’re considering buying a home in San Jose’s 95136 ZIP code, here’s what the May-to-June 2026 numbers may mean for your home search.
95136 Housing Market: May vs. June 2026
| Market Metric | May 2026 | June 2026 | Change |
|---|---|---|---|
| Average Sale Price | $1.31M | $1.28M | ↓ 2.3% |
| Median List Price | $1.24M | $1.21M | ↓ 2.4% |
| Sale-to-List Price Ratio | 104.2% | 100.8% | ↓ 3.4 percentage points |
| Homes Sold | 25 | 27 | ↑ 8% |
| Average Days on Market | 19 | 26 | ↑ 7 days |
These calculations are based on the May and June 2026 market figures provided for this article. Market statistics can vary depending on property type, data source, reporting period, and methodology.
Home Prices Eased Slightly in June
After a competitive spring market, average sale prices moved modestly lower in June.
The average sale price decreased from $1.31 million in May to $1.28 million in June, a decline of approximately 2.3%.
Median list prices moved in the same direction, falling from $1.24 million to $1.21 million.
For buyers, that’s worth watching—but one month of data doesn’t establish a longer-term price trend.
The mix of homes sold during any given month can significantly influence an average. A month with more condos, townhomes, smaller homes, larger homes, or remodeled properties can produce noticeably different numbers.
That’s why buyers should use ZIP-code statistics as a starting point and then look at recent comparable sales for the specific type of property they’re considering.
Buyers Faced Less Upward Price Pressure
This may be the most interesting change in June.
In May, homes sold for an average of 104.2% of their asking price. In June, that figure dropped to 100.8%.
In other words, the average June sale was much closer to the property’s asking price.
That’s encouraging for buyers.
It doesn’t mean bidding competition disappeared, and a sale-to-list ratio alone doesn’t tell us how many homes received multiple offers. But it does show that buyers, on average, weren’t paying as far above asking as they had the month before.
For someone who felt frustrated by the spring market, that change could make the buying process feel a little more manageable.
Buyers Also Had More Time to Make Decisions
Another notable change was days on market.
Homes spent an average of 19 days on the market in May. By June, that increased to 26 days.
Seven additional days may not sound dramatic, but in Silicon Valley real estate, a week can make a meaningful difference.
Buyers may have more time to tour a property, review disclosures, talk with their lender and evaluate comparable sales before deciding how aggressively they want to pursue a home.
Of course, that doesn’t mean every listing will sit for 26 days. A particularly desirable or competitively priced property can still attract attention quickly.
The important shift is that buyers shouldn’t assume every home requires exactly the same offer strategy.
More Homes Sold Despite the Slower Pace
Here’s where the June numbers get particularly interesting.
Even though homes took longer to sell and average prices moved slightly lower, closed sales increased.
There were 25 sales in May compared with 27 in June—an 8% increase.
That’s one reason I wouldn’t characterize these numbers as evidence of a weak market.
Buyers were still purchasing homes.
Instead, the numbers suggest a market where transactions continued while some of the intense upward price pressure seen in May eased.
What Should 95136 Buyers Do Now?
For buyers, this kind of market can create opportunities—but strategy still matters.
First, don’t assume that a home priced at $1.2 million will automatically sell for significantly more. Look at recent comparable sales and the activity surrounding that particular property.
Second, pay attention to days on market. A newly listed property receiving significant interest may call for one strategy, while a home that’s been available for several weeks may present a very different situation.
Third, get your financing organized before you find the home you want. Preapproval, available funds and a clear understanding of your maximum comfortable monthly payment can put you in a much stronger position when it’s time to write an offer.
And finally, don’t let a ZIP-code average determine what you think a particular house is worth. Property condition, size, location, lot characteristics, upgrades, HOA costs and comparable sales can all affect value.
What Does This Mean for 95136 Sellers?
June’s numbers also contain an important message for sellers: pricing matters.
Buyers remained active, but the drop in the sale-to-list ratio suggests sellers shouldn’t automatically assume the market will correct an ambitious asking price for them.
When buyers have more time and more choices, they’re able to compare properties more carefully.
A home that’s prepared well, marketed effectively and priced with current comparable sales in mind may be better positioned to capture buyer attention early.
Is 95136 Becoming a Buyer’s Market?
Based solely on these May-to-June numbers, I wouldn’t go that far.
What we can say is that conditions improved somewhat for buyers in June.
Homes took longer to sell, average sale prices declined modestly, and buyers paid much closer to asking price. At the same time, closed sales increased.
That’s less a story of a market suddenly turning in favor of buyers and more a story of a market becoming more balanced.
And for buyers who have been waiting for a little breathing room, that’s significant.
Remember: 95136 Isn’t One Uniform Market
There’s another important point when looking at ZIP-code statistics.
A ZIP code can contain different property types, price points, home sizes and micro-locations. Condos and townhomes may behave differently from detached single-family homes, and even similar homes can command different prices based on their individual characteristics.
That’s why I encourage buyers to go beyond broad neighborhood or ZIP-code statistics.
When you find a home you’re seriously considering, look at the specific comparable properties that recently sold and evaluate that home on its own merits.
That’s where the numbers become truly useful.
The Bottom Line
June 2026 brought some encouraging changes for buyers in San Jose’s 95136 ZIP code.
Average sale prices moved from $1.31 million to $1.28 million. Average days on market increased from 19 to 26 days. And the average sale-to-list ratio dropped substantially, from 104.2% to 100.8%.
Meanwhile, the number of completed sales increased from 25 to 27.
Put those numbers together, and the picture isn’t of a market that suddenly stopped moving.
It’s a market where buyers gained a little more time and faced less upward price pressure while homes continued to sell.
If you’re thinking about buying in 95136, this is a good reminder that your strategy should depend on the individual property—not just the latest San Jose housing headline.
I can help you review recent comparable sales, understand how a particular home is positioned in today’s market, and develop an offer strategy based on the property, your budget and your real estate goals.
GET YOUR FREE HOME SELLING BOOK
About the Author – Michelle Elliott
With over 20 years of experience navigating the fast-paced Silicon Valley market, I provide a strategic, results-driven approach to residential real estate. My career is built on a foundation of deep local expertise and a relentless commitment to my clients’ success, resulting in over $235 million in lifetime sales volume and a consistent ranking in the top 3% of agents in Santa Clara County and top 2% at Coldwell Banker. My expertise has been featured on KTVU Fox 2, Real Producers and the Willow Glen Resident. She is also the co-host of the San Jose Podcast “Say What You Want About Real Estate”
A Hyper-Local Expert with Global Reach
I specialize in San Jose, in the neighborhoods of Willow Glen (95125 & 95124) Cambrian Park and Almaden, Downtown San Jose/Japantown (95112) markets. As a certified Luxury Property Specialist with Coldwell Banker Realty, I combine high-end marketing strategies with granular neighborhood knowledge to help my clients achieve premium results.
The “Tiger” at the Negotiating Table
My clients have characterized me as a “tiger” at the negotiating table who remains “sweet and patient” with my clients throughout the process. I pride myself on being a fierce advocate for my buyers and sellers, ensuring the best possible terms in every transaction, and I strive to be the best Realtor in 95125! This balance, drive, and tenacity have earned me consistent 5-star ratings across Google, Zillow, Realtor.com, and Yelp.
Michelle Elliott
Michelle@michelleelliottrealtor.com
1712 Meridian Ave, Ste C, San Jose, CA
DRE 01777533