Facebook
 X
X
 Pinterest
 Copy Link
If you’re thinking about buying a home in or around San Jose’s Rose Garden, you may be wondering:
Is the market any different than it was last summer?
The short answer is yes—at least according to the numbers provided for ZIP code 95126.
Homes generally took longer to sell this summer, buyers weren’t paying as far above asking, and July saw considerably more completed sales than the same month last year.
But that doesn’t necessarily mean the market has suddenly flipped in favor of buyers.
Instead, I’d describe it as a market that’s giving buyers a little more room to evaluate each opportunity individually.
Let’s look at what’s changed.
Buyers Weren’t Paying as Far Above Asking
One of the biggest differences between Summer 2025 and Summer 2026 is the relationship between asking prices and final sale prices.
June was actually very similar year over year:
June 2025: Homes sold for an average of 100.5% of list price.
June 2026: Homes sold for an average of 100.6% of list price.
July was a different story.
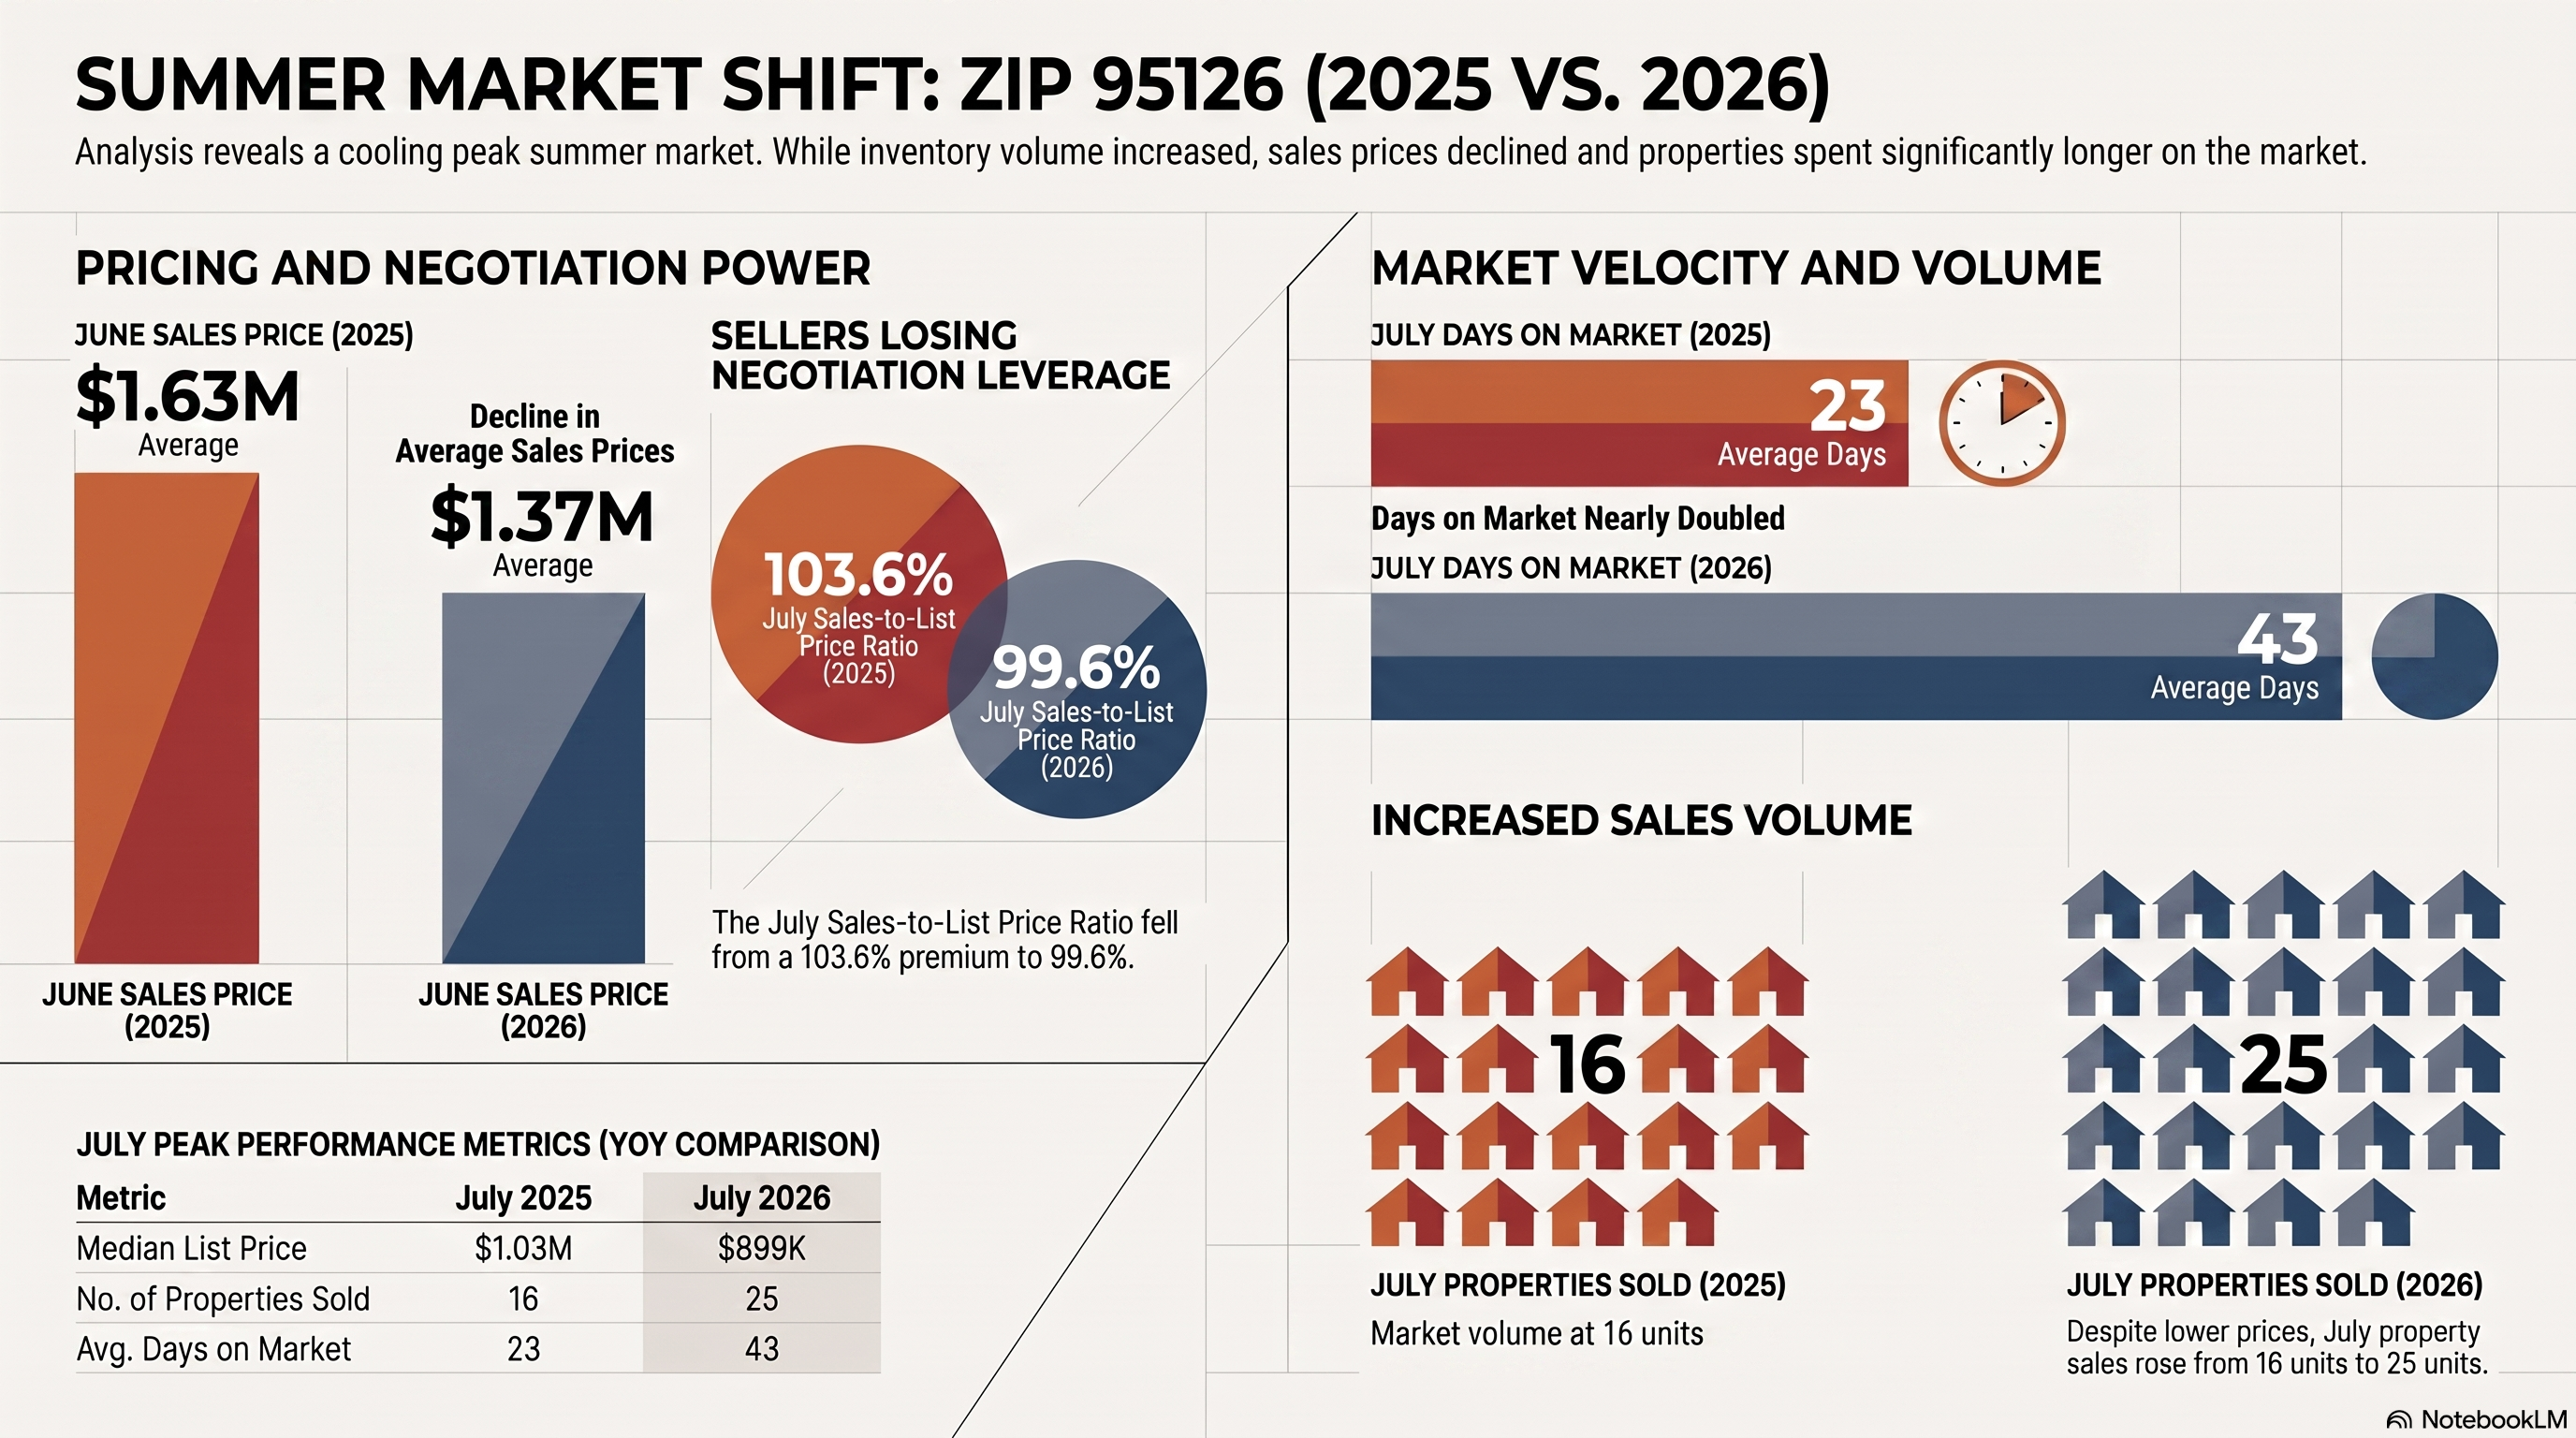
In July 2025, homes sold for an average of 103.6% of list price.
By July 2026, that number had dropped to 99.6%.
That’s a meaningful change.
For buyers, it means you shouldn’t automatically assume that purchasing in 95126 requires offering significantly above asking.
Some homes may still attract multiple offers and sell well above their list price. Others may offer more room for negotiation.
The right offer depends on the specific property, not the ZIP-code average.
Buyers Had More Time This Summer
Here’s another noticeable difference.
Homes generally took longer to sell in 2026.
In June, average days on market increased from 25 days in 2025 to 34 days in 2026.
The July difference was even larger.
July 2025: 23 days
July 2026: 43 days
That’s an additional 20 days on the market on average.
For buyers, that can be helpful.
On certain properties, you may have more time to review disclosures, understand potential repairs, compare recent sales, discuss financing, and decide what you’re actually comfortable paying.
And let’s face it: anything that reduces the “We toured it at noon and offers are due tonight!” experience is probably welcome. 😅
But remember—these are averages.
A well-priced home can still sell very quickly, so having your financing and home-buying strategy ready before you find the right property remains important.
More Homes Closed in July 2026
Despite homes taking longer to sell, the number of completed transactions actually increased.
June was nearly identical:
June 2025: 23 sales
June 2026: 24 sales
July saw a much bigger difference:
July 2025: 16 sales
July 2026: 25 sales
That’s nine additional transactions, or roughly a 56% increase year over year.
That’s certainly worth noting, but I wouldn’t call it proof that buyer demand suddenly surged.
Monthly sales totals can change for many reasons, including inventory, interest rates, the types of properties available, and simply which transactions happen to close during that particular month.
What we can say is that more properties closed in July 2026 than in July 2025.
Sale Prices Were Lower Than Last Summer
Average sale prices also looked different year over year.
In June 2025, the average sale price was $1.63 million, compared with $1.37 million in June 2026.
The difference narrowed in July:
July 2025: $1.44 million
July 2026: $1.38 million
That’s useful market information—but it doesn’t mean every home in the area lost value.
Average sale prices can be heavily influenced by the mix of properties sold.
If one month includes more expensive single-family homes and another includes more condos or townhomes, for example, the average can move substantially without telling us much about how an individual property’s value changed.
For buyers, that’s why recent comparable sales for the type of home you’re considering are far more useful than the overall ZIP-code average.
Asking Prices Changed Too
Median list prices were also lower in 2026.
In June, the median went from $999,000 in 2025 to $975,000 in 2026.
In July, it went from $1.03 million in 2025 to $899,000 in 2026.
Again, I wouldn’t automatically interpret this as sellers deliberately lowering their expectations.
The properties listed during those periods may simply have been different.
Instead, think of it as another indication that the composition and pricing of the market changed from one summer to the next.
So, Is This a Better Market for Buyers?
In some ways, the numbers are encouraging.
Compared with last summer, buyers in July 2026 saw homes stay on the market longer and the average sale-to-list-price ratio fall from 103.6% to 99.6%.
That may create more time or negotiating flexibility on certain properties.
But I wouldn’t go into every showing expecting a discount.
A newly listed home with strong interest may require a completely different strategy than a property that’s been available for 40 days.
Instead of asking:
“Is this a buyer’s market?”
I’d ask:
“What’s happening with homes like the one I want to buy?”
That’s the question that can actually help you make a better decision.
What Should Sellers Take From the Numbers?
For sellers, this year’s data reinforces the importance of a property-specific strategy.
Homes took longer to sell in July 2026 than they did a year earlier, and the average sale-to-list ratio was lower.
That makes pricing, preparation, presentation, and marketing particularly important.
Rather than choosing a list price based on a ZIP-code median or what a neighbor’s home sold for last year, look at current comparable sales and competing listings.
Today’s buyer is responding to today’s market.
The Bottom Line
The Summer 2026 market in 95126 looks different from Summer 2025.
Homes generally took longer to sell. Average sale prices were lower. Buyers weren’t paying as far above asking. And July saw more completed transactions than the same month last year.
That’s not necessarily a market that’s simply “hot,” “cold,” or suddenly favoring one side.
It’s a market with different dynamics than we saw a year ago.
If you’re considering buying in the Rose Garden or elsewhere in 95126, don’t let a headline—or even a ZIP-code average—determine your strategy.
Let’s look at the specific property, recent comparable sales, current competition, market time, and your budget and goals before deciding what makes sense.
Because knowing what’s happening across 95126 is helpful.
Knowing what’s happening with the home you actually want to buy is even better.
Market statistics above are based on the June and July 2025–2026 figures provided for ZIP code 95126 and may include multiple property types and areas outside the Rose Garden neighborhood. Average and median statistics can be influenced by the mix of properties listed or sold during each period and should not be interpreted as a change in value for an individual property.
GET YOUR FREE HOME SELLING BOOK
About the Author – Michelle Elliott
With over 20 years of experience navigating the fast-paced Silicon Valley market, I provide a strategic, results-driven approach to residential real estate. My career is built on a foundation of deep local expertise and a relentless commitment to my clients’ success, resulting in over $235 million in lifetime sales volume and a consistent ranking in the top 3% of agents in Santa Clara County and top 2% at Coldwell Banker. My expertise has been featured on KTVU Fox 2, Real Producers and the Willow Glen Resident. She is also the co-host of the San Jose Podcast “Say What You Want About Real Estate”
A Hyper-Local Expert with Global Reach
I specialize in San Jose, in the neighborhoods of Willow Glen (95125 & 95124) Cambrian Park and Almaden, Downtown San Jose/Japantown (95112) markets. As a certified Luxury Property Specialist with Coldwell Banker Realty, I combine high-end marketing strategies with granular neighborhood knowledge to help my clients achieve premium results.
The “Tiger” at the Negotiating Table
My clients have characterized me as a “tiger” at the negotiating table who remains “sweet and patient” with my clients throughout the process. I pride myself on being a fierce advocate for my buyers and sellers, ensuring the best possible terms in every transaction, and I strive to be the best Realtor in 95125! This balance, drive, and tenacity have earned me consistent 5-star ratings across Google, Zillow, Realtor.com, and Yelp.
Michelle Elliott
Michelle@michelleelliottrealtor.com
1712 Meridian Ave, Ste C, San Jose, CA
DRE 01777533