Facebook
 X
X
 Pinterest
 Copy Link
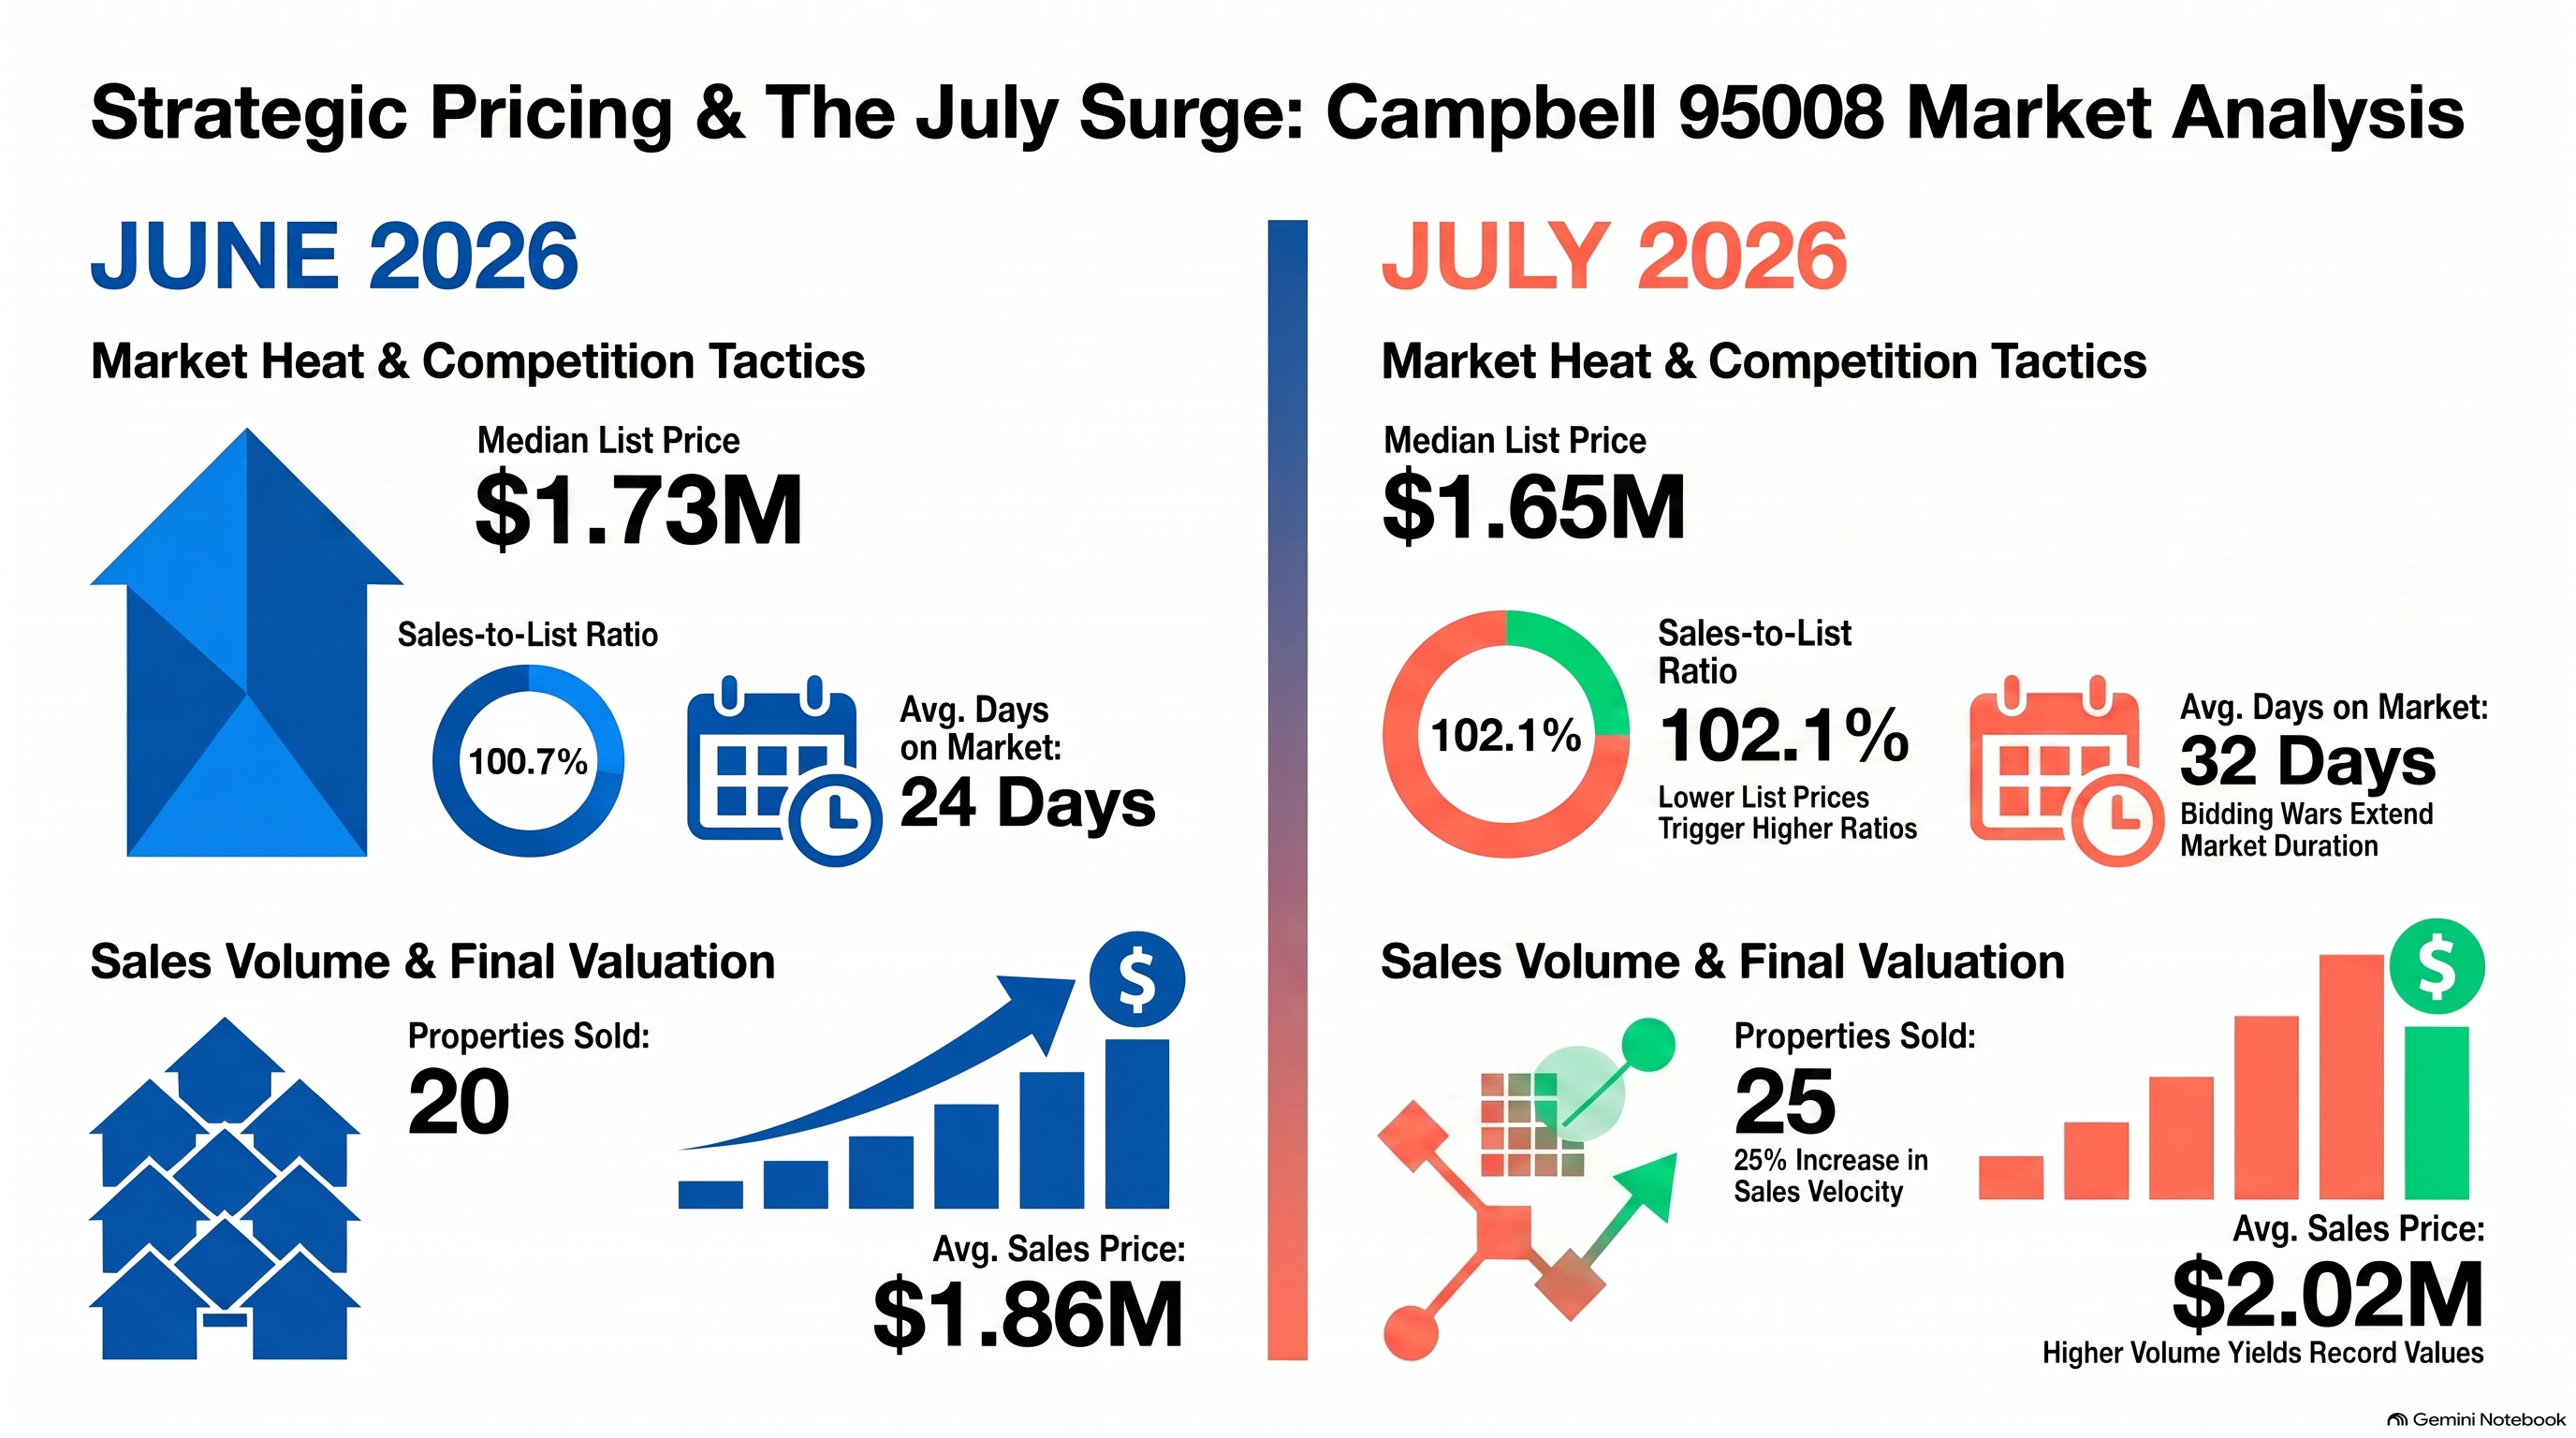
If you’re thinking about buying a home in Campbell, CA, July’s housing numbers tell an interesting story.
On one hand, Campbell homes sold for higher prices in July than they did in June. More properties changed hands, and the average sale-to-list price ratio climbed above 102%.
On the other hand, homes also took longer to sell.
For buyers, that’s an important combination.
It suggests Campbell remains competitive, particularly for properties that attract strong buyer interest, but not every home is moving at the same pace.
Rather than looking at the numbers and assuming you need to rush into every listing, let’s break down what changed from June to July—and how you can use that information when you’re shopping for a home in Campbell.
Campbell Housing Market: June vs. July 2026
Here’s the month-over-month snapshot for Campbell’s 95008 ZIP code, including single-family homes, townhomes and condominiums:
| Metric | June 2026 | July 2026 | Change |
|---|---|---|---|
| Average Sales Price | $1.86M | $2.02M | +8.6% |
| Median List Price | $1.73M | $1.65M | -4.6% |
| Sale-to-List Price Ratio | 100.7% | 102.1% | +1.4 percentage points |
| Properties Sold | 20 | 25 | +25% |
| Average Days on Market | 24 | 32 | +8 days |
At first glance, those numbers seem to be pulling in opposite directions.
Prices increased.
Homes sold further above asking.
More properties closed.
But homes also spent more time on the market.
For buyers, that’s exactly why you don’t want to make decisions based on one statistic—or one headline.
Campbell Home Prices Rose in July
The average sales price increased from approximately $1.86 million in June to $2.02 million in July, an increase of about $160,000, or 8.6%.
That’s a sizable one-month change.
But buyers should be careful about interpreting that as meaning every Campbell home suddenly became 8.6% more expensive.
Monthly averages can shift based on the mix of properties that sold.
For example, if July included more higher-priced single-family homes and fewer lower-priced condos or townhomes, that could pull the overall average upward.
That’s particularly important in Campbell because ZIP code 95008 includes a mix of housing types and price points.
If you’re shopping for a $1.3 million townhome, a $2.02 million citywide average isn’t nearly as useful as recent sales of comparable Campbell townhomes.
The same goes for someone shopping for a detached single-family home.
Buyer takeaway: Don’t build your offer strategy around Campbell’s overall average sales price. Look at recent closed sales that actually resemble the property you’re considering.
Homes Sold Above Asking—But That Doesn’t Mean You Should Automatically Bid 2% Over
July’s sale-to-list price ratio reached 102.1%, up from 100.7% in June.
That’s evidence that Campbell buyers were collectively paying more relative to asking prices in July.
But here’s where I’d be careful.
It does not mean you should automatically offer 102.1% of the asking price on the next Campbell home you see.
List price and market value aren’t necessarily the same thing.
A seller may price aggressively.
Another may price directly in line with recent comparable sales.
And another may intentionally position a property below expected market value to attract more attention.
That’s why I don’t recommend using a formula such as:
“Campbell homes are selling 2% over asking, so we’ll offer 2% over asking.”
Instead, look at what comparable properties actually closed for.
The better question is:
What is this particular Campbell home likely worth based on recent sales and current competition?
That’s what should guide your offer.
More Campbell Homes Sold in July
Closed sales increased from 20 properties in June to 25 in July, a 25% month-over-month increase.
For buyers, more transactions can be useful.
Every closed sale gives us another data point for understanding what buyers are actually willing to pay.
And that’s particularly valuable in a market where asking prices don’t always tell the whole story.
If you’re house hunting now, I’d look closely at July’s closed sales in your particular segment.
What did $1.5 million buy?
What did $1.8 million buy?
What did $2 million buy?
How large were the homes?
What condition were they in?
Did they have an HOA?
How large were the lots?
How close were they to Downtown Campbell?
And how much did they ultimately sell for compared with their asking prices?
That gives you a much better understanding of the market you’re entering.
Here’s the Interesting Part: Homes Took Longer to Sell
Average days on market increased from 24 days in June to 32 days in July.
That’s a 33% increase.
And for buyers, this may be the most interesting number in the entire report.
Campbell’s average sales price increased and homes sold further above asking, yet the average property took longer to sell.
That tells us the market deserves a more nuanced interpretation than simply calling it “hot” or “cold.”
One possible explanation is that older listings that had already spent more time on the market finally sold during July.
The data provided here doesn’t tell us exactly why days on market increased, so I wouldn’t assume every Campbell buyer suddenly had eight additional days to make a decision.
But it does give buyers a reason to look more closely at individual listing history.
A Home That’s Been Listed for 30 Days Is a Different Conversation
This is where market data becomes useful in an actual home search.
Imagine two Campbell homes.
Home A was listed three days ago, is priced competitively and already has substantial buyer interest.
Home B has been available for 32 days and has already had a price reduction.
Those properties may require completely different offer strategies.
With Home A, we may need to understand the offer deadline, competition and seller priorities quickly.
With Home B, I’m going to want to know:
Why hasn’t it sold?
Has the seller received previous offers?
Has it fallen out of contract?
Has the price changed?
Are there property-condition concerns?
How does its current price compare with recent sales?
Is the seller becoming more flexible?
Longer market time doesn’t automatically mean there’s something wrong with a property.
But it can create a different negotiating environment.
That’s where buyers may find opportunity.
Don’t Assume Every Campbell Listing Will Become a Bidding War
The 102.1% average sale-to-list ratio tells us competition was real in July.
But averages can hide significant differences between properties.
Some homes may sell substantially above asking.
Others may sell near asking.
And some may require a price reduction before finding a buyer.
That’s why buyers shouldn’t enter every Campbell open house assuming they’ll immediately need to waive everything and dramatically increase their price.
First, determine what kind of listing you’re dealing with.
A newly listed, remodeled home with multiple interested buyers is one situation.
An older listing with limited activity is another.
Your strategy should respond to the property—not just the ZIP code.
What Does Your Budget Actually Buy in Campbell?
This is one of the first exercises I’d recommend for a Campbell buyer.
Forget the $2.02 million average for a minute.
Start with your budget.
Let’s say you’re comfortable purchasing up to $1.6 million.
Instead of asking whether Campbell’s average home costs more than $2 million, let’s pull everything that actually sold around $1.6 million during the last few months.
Then compare:
Property type.
Bedrooms and bathrooms.
Square footage.
Location.
Lot size.
Condition.
HOA dues.
Parking.
Days on market.
Original list price.
Final sale price.
You may discover your budget primarily puts you into Campbell condos and townhomes.
Or there may be single-family opportunities depending on location, size and condition.
That’s much more useful than deciding whether Campbell is “affordable” based on one citywide statistic.
June vs. July 2025 Shows a Similar Summer Pattern
There’s another useful piece of context in the data.
Campbell experienced a somewhat similar shift last summer.
The average sales price increased from approximately $1.65 million in June 2025 to $1.72 million in July 2025.
Average days on market also increased from 12 days to 22 days.
That doesn’t guarantee the same pattern will continue in August or September 2026.
One year isn’t enough to establish a reliable seasonal rule.
But it does show that rising summer prices and longer market times aren’t necessarily contradictory in Campbell.
That’s worth remembering when you see headlines trying to describe the entire market with one word.
Should Campbell Buyers Wait Because Homes Are Taking Longer to Sell?
I wouldn’t make a buying decision based solely on one month’s increase in days on market.
Trying to perfectly time Silicon Valley real estate is difficult because your individual buying opportunity depends on much more than a monthly statistic.
Interest rates can change.
Inventory changes.
Your financing changes.
Different properties come to market.
And a home that perfectly matches what you’re looking for may not appear again for months.
Instead of trying to predict the perfect month to buy, I’d focus on whether:
You’re financially ready.
The right property is available.
The price is supported by comparable sales.
The monthly payment works comfortably for you.
You’ve completed appropriate due diligence.
The home fits your longer-term plans.
Those factors matter much more than whether Campbell’s average days on market moved from 24 to 32 days in one month.
Where Campbell Buyers May Have More Leverage
If you’re looking for negotiating opportunities, don’t necessarily start with the newest listing on the market.
Look for properties with:
- Longer days on market
- Price reductions
- Previous pending sales that returned to market
- Limited showing activity
- Less competitive property characteristics
- Sellers with timing considerations
- Listings that may have initially been priced too aggressively
None of these automatically means you’ll get a bargain.
But they’re situations where I’d want to ask more questions.
In a market where the average home sold above asking, finding the listings where competition is weaker can matter.
Where Campbell Buyers Should Be Prepared to Move Quickly
The other side of the market hasn’t disappeared.
If a well-priced Campbell home hits the market and checks a lot of buyer boxes, you may still face competition.
Before that happens, have your financing ready.
Know your comfortable maximum price.
Understand your down payment and closing costs.
Review disclosures as early as possible.
Ask your lender what flexibility you have.
And decide which offer terms you’re comfortable with before you’re competing against other buyers.
Preparation doesn’t mean automatically making the highest offer.
It means being able to make a thoughtful decision without scrambling.
Campbell Isn’t One Housing Market
This is especially important when interpreting these numbers.
ZIP code 95008 includes single-family homes, townhomes and condominiums.
Those aren’t interchangeable.
A Downtown Campbell condo may behave very differently from a detached home in another part of the city.
Price point matters.
Condition matters.
Location matters.
HOA costs matter.
Lot size matters.
Proximity to Downtown Campbell, the Pruneyard, parks, transportation and other amenities can matter.
That’s why I’d use the overall Campbell numbers as context, then narrow the analysis to the exact type of home you’re trying to buy.
What Campbell Buyers Should Take Away From July 2026
July’s numbers don’t tell me buyers should panic.
They also don’t tell me buyers suddenly have unlimited negotiating power.
Instead, they show a competitive but uneven market.
Average sale prices increased.
More homes sold.
The sale-to-list ratio strengthened.
But average market time also increased.
For a buyer, that means strategy matters.
Don’t treat every Campbell listing the same.
A home that’s been available for a month deserves a different conversation from one receiving multiple offers after its first weekend.
And an asking price shouldn’t determine your offer by itself.
Recent comparable sales, competition, property condition and your own financial limits should.
The Bottom Line for Campbell Home Buyers
If you’re buying a home in Campbell in 2026, July’s market data gives you two important messages.
Competition is still very real for the right properties.
But…
There may also be opportunities when a home doesn’t sell immediately.
The key is knowing which situation you’re walking into.
Rather than asking, “How much over asking do I need to offer in Campbell?”, I’d start with:
“What is this home worth, how much competition am I actually facing, and what terms make sense for me?”
Those are much better questions.
If you’re considering buying in Campbell, I can help you look beyond the headline numbers and compare recent closed sales, listing history, property condition and current competition before you decide what—and whether—to offer.
Because the goal isn’t simply to win a house.
It’s to make a smart purchase that still makes sense after the excitement of offer day is over.
GET YOUR FREE HOME SELLING GUIDE
About Michelle Elliott
With more than 20 years of experience navigating Silicon Valley real estate—and more than two decades calling Willow Glen home—I bring both professional market knowledge and firsthand neighborhood experience to my clients.
I specialize in San Jose neighborhoods including Willow Glen, Cambrian, Almaden, Japantown and Downtown San Jose. As a Luxury Property Specialist with Coldwell Banker Realty, I combine hyper-local market knowledge, strategic marketing and strong negotiation to help buyers and sellers make informed real estate decisions.
My real estate insights have been featured on KTVU Fox 2, Real Producers and Willow Glen Resident, and I co-host the San Jose real estate podcast Say What You Want About Real Estate.
Michelle Elliott | Coldwell Banker Realty
408-839-7915
Michelle@michelleelliottrealtor.com
MichelleElliottRealtor.com
DRE 01777533