Cambrian Park Housing Market Update: October 2025 vs. October 2026
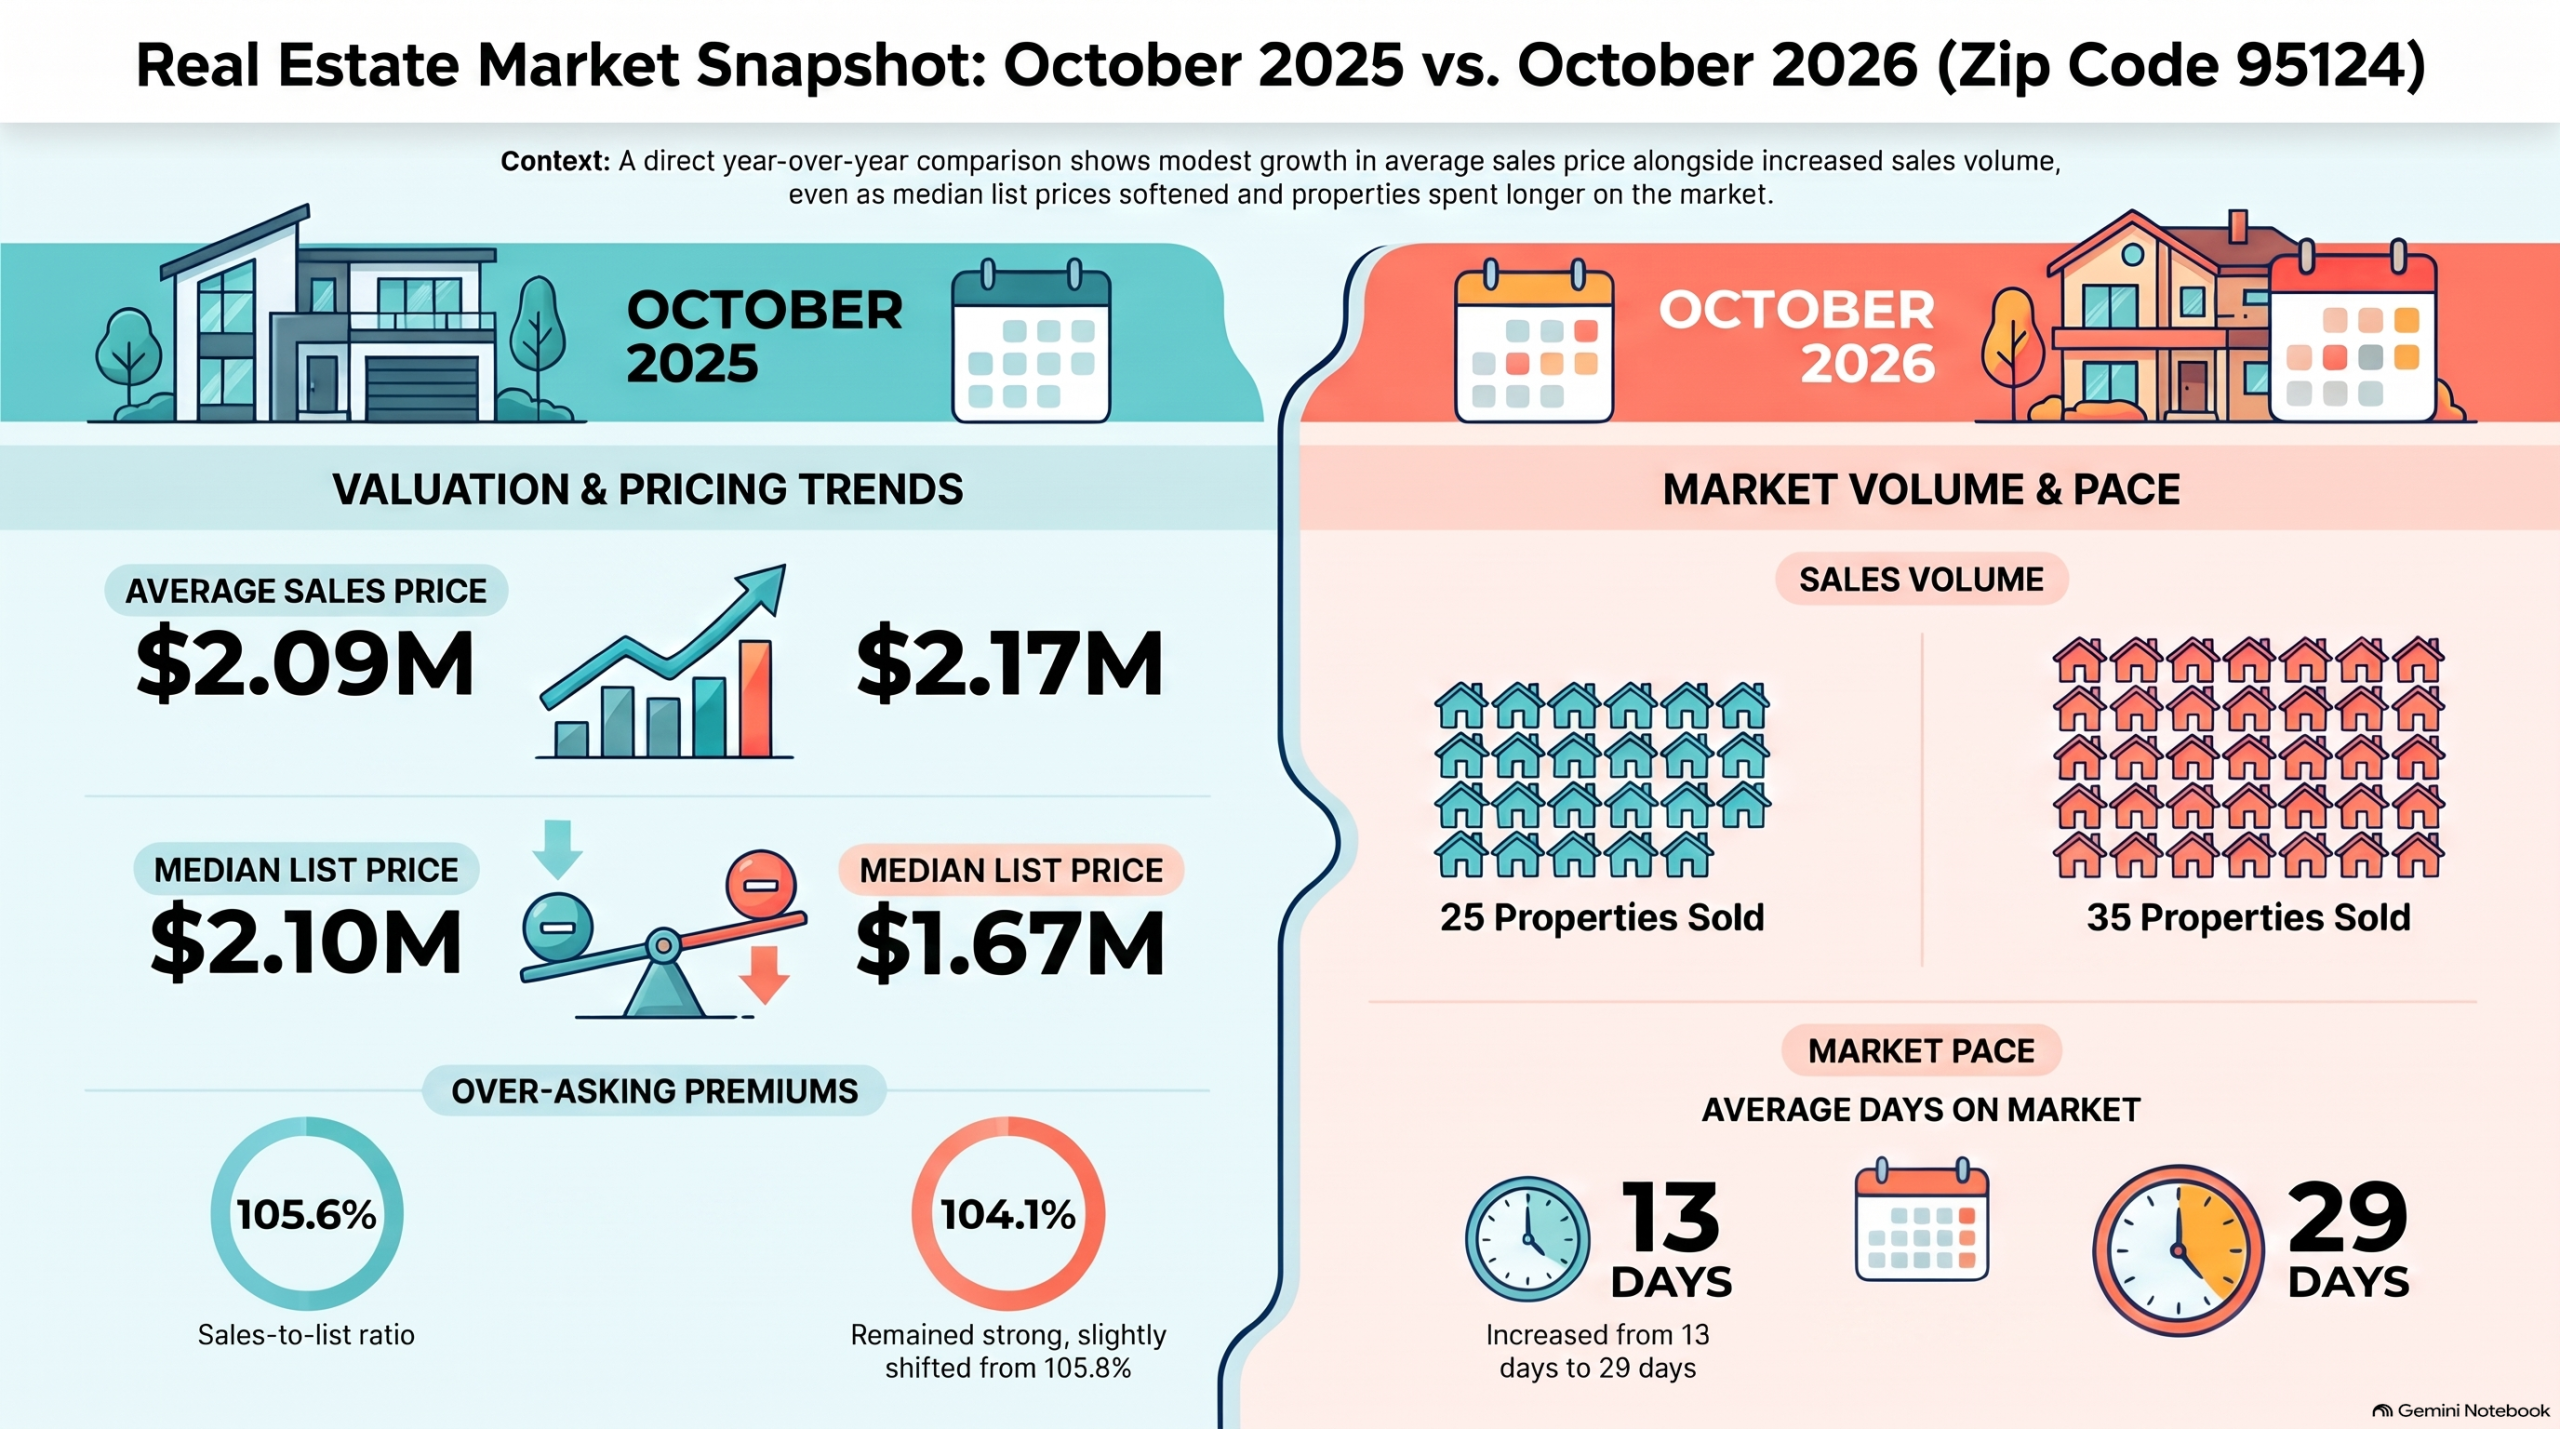
Home prices are up, more properties are selling, and buyers may have a little more time to make decisions. But homes in San Jose's 95124 ZIP code are still selling above asking price. What does this mean if you're thinking about buying or selling in Cambrian Park?
If you've been watching the Cambrian Park real estate market, you know that Silicon Valley housing trends don't always move in the same direction.
Sometimes prices increase while homes take longer to sell. Other times, more properties close even as the premium buyers pay above asking price begins to narrow.
That's what makes the October 2025 versus October 2026 comparison for San Jose ZIP code 95124 so interesting.
According to the reported figures, average sales prices increased approximately 3.8%, closed sales jumped 40%, and average days on market increased from 13 to 29 days.
Meanwhile, homes continued selling above asking price overall, with a sales-to-list-price ratio of 104.1% in October 2026.
The biggest takeaway? Cambrian's housing market showed higher average sales prices and more completed transactions, even as homes spent longer on the market.
Let's take a closer look at what changed and what these numbers could mean for your next move.
Here's how residential real estate activity compared year over year in San Jose ZIP code 95124.
| Market Indicator | October 2025 | October 2026 | Year-Over-Year Change |
|---|---|---|---|
| Average Sales Price | $2.09M | $2.17M | +3.8% |
| Median List Price | $2.10M | $1.67M | -20.5% |
| Sales-to-List Price Ratio | 105.6% | 104.1% | -1.5 percentage points |
| Properties Sold | 25 | 35 | +40.0% |
| Average Days on Market | 13 | 29 | +123.1% |
At first glance, these numbers may seem contradictory.
Average sales prices increased, but median asking prices decreased. More homes sold, yet properties spent considerably longer on the market.
However, these figures measure different aspects of the housing market, and each tells an important part of the story.
It's also important to remember that ZIP code 95124 includes areas beyond Cambrian Park and encompasses different property types.
For additional perspective on how the local market has evolved, read my June vs. July 2026 Cambrian Housing Market Update.
1. Average Home Sales Prices Increased 3.8% in Cambrian
One of the most notable changes in October 2026 was the increase in average sales prices.
In October 2025, the average residential property in ZIP code 95124 sold for approximately $2.09 million.
By October 2026, that figure had increased to $2.17 million.
That's an $80,000 increase, representing approximately 3.8% year over year.
For homeowners watching the market, this is an interesting development.
But does that mean every Cambrian Park property increased in value by 3.8%?
Not necessarily.
Why Average Sales Prices Don't Tell the Whole Story
Average sales prices reflect the properties that closed during a particular reporting period.
San Jose's 95124 ZIP code includes homes with different square footage, lot sizes, conditions, and property types.
If more higher-priced homes close during one month, the average may increase even if comparable properties haven't appreciated by the same percentage.
For buyers, this is why reviewing recent comparable sales is essential.
A remodeled single-family home may require a different pricing analysis than an older property needing significant improvements.
Rather than relying on the ZIP code average, evaluate what similar properties have actually sold for.
If you're comparing neighborhoods and budgets, my article on What $2 Million Buys in Willow Glen, Almaden Valley, and Cambrian offers additional perspective on housing options across San Jose.
2. Median Listing Prices Declined More Than 20%
Here's where the numbers get especially interesting.
While average sales prices increased, median listing prices moved significantly lower.
In October 2025, the median listing price was $2.10 million.
By October 2026, that figure had decreased to $1.67 million.
That's a difference of $430,000, representing approximately 20.5%.
How can asking prices decline while average sales prices increase?
The answer is that these statistics measure different things.
The median listing price represents the midpoint of reported asking prices, while the average sales price reflects completed transactions.
They may also represent different groups of properties.
For example, a month with more moderately priced listings but higher-priced closed transactions could produce this combination.
These figures alone don't establish that individual sellers reduced their asking prices by 20.5%.
What Should Cambrian Homebuyers Know?
A lower median listing price doesn't automatically mean every home is more affordable.
Instead, buyers should focus on how a particular property compares with recent sales.
Before making an offer, consider:
- Recent sales of similar homes
- Property condition and available disclosures
- Square footage, lot size, and improvements
- Listing history and price adjustments
- Current competing inventory
- Financing costs and monthly ownership expenses
Understanding these factors can help you determine whether a listing is competitively priced.
For another perspective on local budgets, explore my guide to What $1.5 Million Buys in San Jose, Including Cambrian.
3. Cambrian Homes Continued Selling Above Asking Price
Despite changes in listing prices and marketing times, homes continued selling above asking price overall.
In October 2025, the reported sales-to-list-price ratio was 105.6%.
In October 2026, it was 104.1%.
That's a decline of 1.5 percentage points.
In practical terms, the reported ratio indicates that final sales prices exceeded asking prices by approximately 4.1% in October 2026, compared with 5.6% a year earlier.
Does This Mean Buyers Still Face Competition?
The figures suggest that above-asking sales remained part of the market.
However, a ratio above 100% doesn't mean every home attracted multiple offers or sold above asking price.
Some properties may receive substantial interest, while others may sell at or below their listing price.
For buyers, the lesson is to avoid assuming every property requires the same offer strategy.
A newly listed home attracting strong interest may call for a different approach than a property that's been available for several weeks.
The goal isn't simply to offer above asking price. It's to understand the property's market value and make an informed decision.
For a broader discussion of negotiating conditions, read my article Is San Jose a Buyer's Market in 2026?.
4. Homes Spent More Time on the Market
Another significant change involves the average number of days properties spent on the market.
In October 2025, homes averaged 13 days on market.
By October 2026, that number had increased to 29 days.
That's an additional 16 days, representing a 123.1% increase.
Although the percentage change sounds dramatic, the practical difference is a little over two weeks.
What Does This Mean for Buyers?
Longer marketing times may give buyers additional opportunities to evaluate listings, review disclosures, and understand comparable sales before making an offer.
However, that doesn't mean every home will remain available for 29 days.
Some properties may still sell quickly, particularly when priced competitively.
Others may take longer depending on condition, pricing, and current competition.
It's also important to understand that days on market doesn't necessarily measure the time between listing and closing.
The exact calculation depends on how the MLS data was reported.
For buyers, the best approach is to be financially prepared while taking the time needed to evaluate each property carefully.
The Consumer Financial Protection Bureau's homebuying resources offer useful guidance on preparing financially and understanding the purchase process.
5. Cambrian Home Sales Increased 40%
One of the biggest changes in the October comparison was the increase in completed transactions.
In October 2025, 25 properties sold.
In October 2026, 35 properties sold.
That's 10 additional sales, representing a 40% year-over-year increase.
This shows that more transactions closed during October 2026 than during the same month a year earlier.
Does Higher Sales Volume Mean Buyer Demand Is Increasing?
It may reflect greater market activity, but closed sales alone don't establish the cause.
Transaction volume can be influenced by available inventory, the mix of properties for sale, financing timelines, and the number of transactions reaching closing during a particular month.
Without reviewing inventory levels, pending sales, and new listings, we can't determine whether the increase resulted from stronger demand, greater supply, or a combination of factors.
Still, the increase in completed transactions is an important part of the October 2026 market picture.
For sellers, it demonstrates that properties continued changing hands across the ZIP code.
For buyers, it reinforces the importance of understanding current competition rather than assuming longer marketing times mean activity has slowed across every price range.
For additional context, my September 2026 San Jose 95124 Market Update examines how pricing and selling timelines changed earlier in the fall.
Is Now a Good Time to Buy a Home in Cambrian Park?
If you're considering purchasing a home in Cambrian Park or elsewhere in San Jose's 95124 ZIP code, the October 2026 figures present an interesting combination.
Average sales prices increased, but homes spent more time on the market.
Meanwhile, the sales-to-list-price ratio remained above 100%, although the premium relative to asking prices was smaller than a year earlier.
For buyers, this suggests that preparation and property-specific research remain essential.
Three Things I'd Recommend Before Making an Offer
1. Understand the local comparable sales.
Review recent transactions involving homes similar in size, condition, and location.
2. Look beyond the asking price.
A lower listing price doesn't automatically mean a property is undervalued. Understanding how the home compares with recent sales is essential.
3. Know your complete ownership costs.
Mortgage payments are only part of the equation. Property taxes, homeowners insurance, maintenance, and applicable HOA fees should also be considered.
The Consumer Financial Protection Bureau's Loan Estimate guide is a helpful resource for understanding mortgage terms, estimated payments, and closing costs.
Whether now is the right time to buy ultimately depends on your financial situation, housing needs, and long-term goals.
What Should Cambrian Home Sellers Know?
For homeowners considering selling, the October 2026 numbers highlight why strategic pricing and thoughtful preparation remain important.
Average sales prices increased, and more properties sold than in October 2025.
However, homes also spent more time on the market, and the sales-to-list-price ratio declined slightly.
This combination suggests that sellers should avoid relying on broad market averages when determining an asking price.
Instead, review recent comparable sales, current competing listings, property condition, and buyer activity within the relevant price range.
Professional photography, thoughtful preparation, effective marketing, and a well-supported pricing strategy can help position a home competitively.
For a longer-term perspective on this ZIP code, read my article Why 95124 Continues to Be One of San Jose's Strongest Markets.
A property-specific market analysis is much more useful than assuming every home in ZIP code 95124 experienced the same appreciation.
The Bottom Line: Cambrian's Housing Market Shows Higher Prices and More Sales
The October 2025 versus October 2026 comparison reveals several important changes in the San Jose 95124 real estate market.
Average sales prices increased 3.8%, while median listing prices declined approximately 20.5%.
Closed sales increased 40%, and homes spent an average of 16 additional days on the market.
Meanwhile, the sales-to-list-price ratio remained above 100%, moving from 105.6% to 104.1%.
For buyers, the longer average marketing period may provide more opportunities to evaluate properties, but above-asking sales remain an important consideration.
For sellers, the increase in average sales prices and transaction volume is worth noting, while longer marketing times reinforce the importance of competitive pricing.
The biggest takeaway? Cambrian's housing market isn't defined by one statistic. Understanding the property, the competition, and the current comparable sales is what matters most.
Frequently Asked Questions About the Cambrian Park Housing Market
What was the average home sales price in Cambrian Park in October 2026?
The reported average residential sales price in San Jose ZIP code 95124 was $2.17 million in October 2026, compared with $2.09 million in October 2025. This represents an increase of approximately 3.8%.
Are Cambrian Park home prices increasing in 2026?
The reported average sales price increased 3.8% between October 2025 and October 2026. However, changes in the mix of properties sold can affect averages, so individual home values may differ.
Are homes selling above asking price in San Jose 95124?
The reported sales-to-list-price ratio was 104.1% in October 2026, compared with 105.6% in October 2025. This indicates that final sales prices exceeded asking prices in aggregate, although individual transactions varied.
How long does it take to sell a home in Cambrian Park?
Properties averaged 29 days on the market in October 2026, compared with 13 days in October 2025. Actual marketing times depend on property condition, pricing, location, and competition.
How many homes sold in San Jose 95124 in October 2026?
Thirty-five properties sold in October 2026, compared with 25 in October 2025. That's a 40% increase in completed transactions.
Why did median listing prices decrease while average sales prices increased?
Median listing prices and average sales prices measure different groups of properties and different stages of the real estate process. Changes in the mix of homes listed and sold can cause the two figures to move in opposite directions.
Is Cambrian Park a buyer's or seller's market in October 2026?
The October 2026 figures show above-asking sales in aggregate, longer average marketing times, and more closed transactions. However, inventory levels and property-specific competition are also needed to determine whether the broader market favors buyers or sellers.
Is now a good time to buy a home in Cambrian Park?
Whether buying makes sense depends on your budget, financing, preferred property type, and long-term plans. Reviewing recent comparable sales and understanding current competition can help you evaluate individual opportunities.
What should I consider before selling my home in Cambrian Park?
Start by reviewing recent comparable sales, active listings, property condition, and local buyer activity. A property-specific pricing and marketing strategy can help you make informed decisions about listing your home.
Thinking About Buying or Selling in Cambrian Park?
Whether you're searching for a home in Cambrian Park, exploring other South San Jose neighborhoods, or considering selling your current property, I'd love to help you understand your options.
Real estate decisions are too important to base on headlines alone.
Let's review the latest comparable sales, discuss your goals, and develop a strategy that makes sense for your next move.
Michelle Elliott | Coldwell Banker Realty | DRE #01777533
Phone: 408-839-7915 | Email: michelle@michelleelliottrealtor.com
Downtown San Jose
Almaden